 |
| SUPER TREND PICTURE |
How to Get Clear Picture of Trend by Super Trend :
Introduction :
In this article we are going to discuss, understand and learn about the Technical Indicator Super Trend. What is Super Trend? How it help us to understand Trend? Benefit of Super Trend?
What is Super Trend?
Super Trend is the Technical Indicator used to judge the Market ie Index or Stock direction or trend up or down based on the cut off movement as per condition.
How Super Trend help us to understand Trend?
 |
| SUPER TREND CHART |
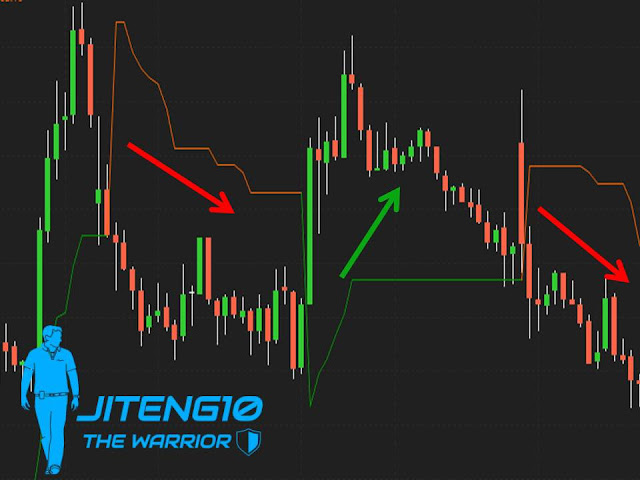
As per above picture you can understand that at inside Box A you can see that a Green line which is situated below the uptrend Green candles get converted into Red line and moves above the downtrend Red candles. Here the situation changes from positive to negative.
Similarly at inside Box B you can see that a Red line which is situated above the downtrend Red candles get converted into Green line and moves below the uptrend Green candles. Here the situation changes from negative to positive.
And the Box C condition is similar condition as Box A.
What do you understand from the above conversation?
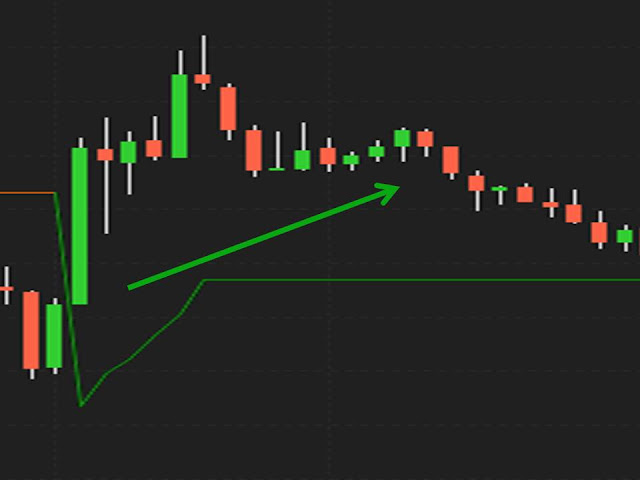
Upto the time the candle are above the Green line than Trend is Upward and it is called as Buying
Zone.
 |
| UPTREND |
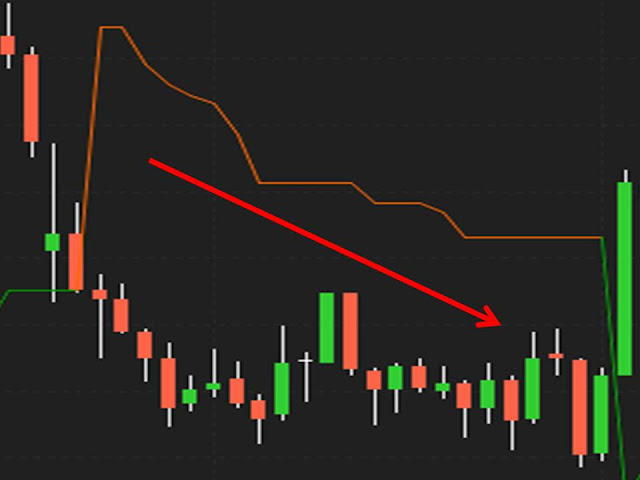
Upto the time the candle move below the Red line than Trend is Downward and it is called as Sell Zone.
 |
| DOWNTREND |
Benefit of Super Trend?
Super Trend is fast acting Technical indicator and we should learn it how to use.
It gives very clear cut picture of Market Trend direction up or down.
Use of it help us to take fast decision to buy or sell the stock or index.
Also we can track the trend and wait for cut off and plan trade as per our requirement.
So Friends hope now you understand how to use the Super Trend in trading. All the best!
Disclaimer : This article is only for knowledge and information sharing and not for any type of recommendation.


0 Comments
Please do not enter any spam in the comment box.